The Swedish Pensions Agency has investigated what people would choose if they had freedom of choice, while remaining financially consistent, between when they want to retire, the size of their pension and how much they want to save.
In this context, that the choices are ‘financially consistent’ means that the three factors are mutually dependent. For example, if a pension contributor or saver wants to have a higher pension level, they must choose a higher pension age and/or a larger personal pension savings pot. Similarly, they must choose a lower pension level and/or a larger personal pension savings pot if they opt to retire early.
The balance between these three factors corresponds to the conflicting goals which are the pivotal decisions regarding any pension scheme which every pension saver must face ahead of their retirement. Anyone who makes decisions concerning either compulsory or voluntary pensions (legislators, employers’ organisations, trade unions and individuals) must make either conscious or subconscious choices regarding these three factors.
This report presents the results of a survey conducted in spring 2020. In the survey, participants were first asked questions about their preferred pension level, pension age and pension savings pot, based on the unrealistic assumption that the choices were independent of each other. The same people were then asked the same questions, but this time assuming that the three factors were mutually dependent, i.e. a higher pension age and/or a larger pension savings pot results in a higher pension level and vice versa. A similar survey was conducted in spring 2018.
The aim of the survey is to raise awareness of the balances that pension savers must strike and the preferences they have when it is clear they must take account of the interdependency between the three different choices.
The respondents indicated earnings, pension level and any pension savings in SEK. To compare pensions and savings between individuals with different earnings, we have used the parameters ‘replacement rate’ and ‘savings ratio’ in this report. Replacement rate usually refers to the size of the pension expressed as a proportion of final earnings. However, in this case, it is calculated based on the earnings that the respondent is currently receiving according to the person themselves. The savings ratio refers to the amount of savings expressed as a proportion of current earnings.
Respondents were asked to state both their current earnings and their preferred savings before tax.
Note that the model used in the survey is simplified. For example, the model assumes that the earnings that the respondent declares are the earnings that they have received throughout their life, even though in reality earnings will change over the course of a person’s lifetime. It should also be noted that the preferred savings amount was calculated as the amount that respondents saved every month throughout their entire life in the model, while in reality most people do not save the same amount over this period.
Outliers have been excluded from the presentation of the survey results.1
Table 1 and table 2 show the mean and spread respectively, expressed in standard deviations, for replacement rate, pension age and savings ratio based on the chosen pension levels, pension ages and savings amounts. The corresponding values from the 2018 survey are stated in parentheses. The mean replacement rate is around 69 percent, while the mean pension age is approximately 65 years. The mean savings amount corresponds to around 6 percent of current earnings. The standard deviation (the average deviation from the mean) for replacement rate is 23 percent, while the corresponding values for the chosen pension age and savings ratio are approximately four years and six percent respectively. The fact that the standard deviation for replacement rate is 23 percent means that respondents deviate by an average of 23 percentage points from the mean of 69 percent in their chosen replacement rate. The differences between men and women are marginal in terms of both mean and standard deviation values.
It should be noted that, in this context, ‘savings ratio’ refers to savings over and above the compulsory saving that automatically take places via a person’s employer to their general pension and occupational pension schemes, which usually amount to approximately 22 percent for earnings up to the social security ceiling of approximately SEK 45,000 per month and about 30 percent for earnings above this level. Depending on the agreement, the provisions may be larger, while for those without an occupational pension, they are lower. In the 2020 survey, respondents were given information about how much is set aside for their pension by their employer, which respondents in the 2018 survey were not told. This information could impact on how respondents value their savings and thus their chosen savings level. However, it is apparent that the amount that the respondents decide to save is relatively similar between the surveys.
| Parameter | Women | Men | Total |
|---|---|---|---|
| Pension age | 65.05 (65.31) | 65.00 (64.72) | 65.03 (64.98) |
| Replacement rate | 70 % (71 %) | 69 % (67 %) | 69 % (68 %) |
| Savings ratio | 5 % (5 %) | 6 % (5 %) | 6 % (5 %) |
| Parameter | Women | Men | Total |
|---|---|---|---|
| Pension age | 3.95 (4.08) | 4.34 (4.20) | 4.17 (4.16) |
| Replacement rate | 23 % (24 %) | 23 % (22 %) | 23 % (23 %) |
| Savings ratio | 5 % (5 %) | 6 % (6 %) | 6 % (6 %) |
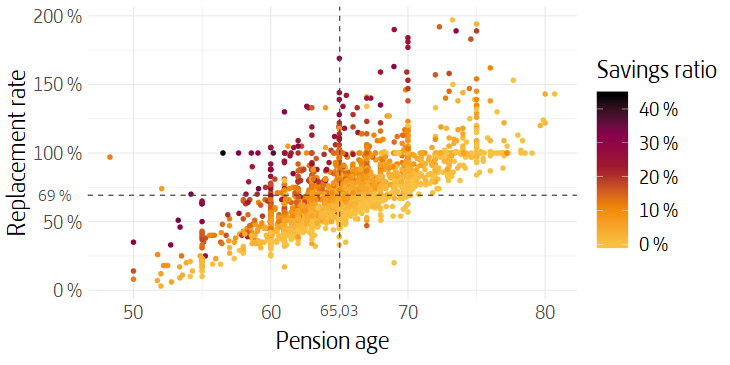
To visualise how the three choices are interlinked, figure 1 shows the respondents’ chosen pension age, replacement rate and savings ratio. The vertical axis shows the replacement rate, the horizontal axis shows pension age, and a darker dot indicates a higher savings ratio. The black dashed lines indicate the mean values for replacement rate and pension age respectively. The links between the three parameters are apparent from the fact that respondents who chose a relatively high pension level, and thus a high replacement rate, have had to pay for this choice via either a larger savings pot (a darker dot) or a higher pension age (a position further to the right). Respondents who chose a relatively low pension age have had to pay for their choice via either a higher savings pot or a lower replacement rate.
Figure 1 shows that there is a wide spread among respondents, many of whom have chosen relatively extreme values. Many have chosen a pension level corresponding to their current earnings, on the basis of the many dots along the line for 100 percent replacement rate, as well as pension levels which exceed their current earnings, even though most respondents were more realistic and chose pension levels that result in a replacement rate of less than 100 percent. It is also apparent that many people have chosen relatively low pension ages and that there is a tendency to choose ‘round’ pension ages, as indicated by the many dots along the lines for 55, 60, 65, 70 and 75 years.
The survey results also provide information on the respondents’ current earnings levels and ages. The box plot in figure 2 shows the composition of the participants and how gender and age co-vary with earnings. The vertical axis describes the spread in earnings within the various age groups, while a darker colour shows the proportion of women in the group. The width of each box corresponds to the number of people in each group. The figure shows that the proportion of women is highest in the lowest age group. Earnings are relatively evenly distributed across different earnings levels, but earnings are generally lower among younger people.
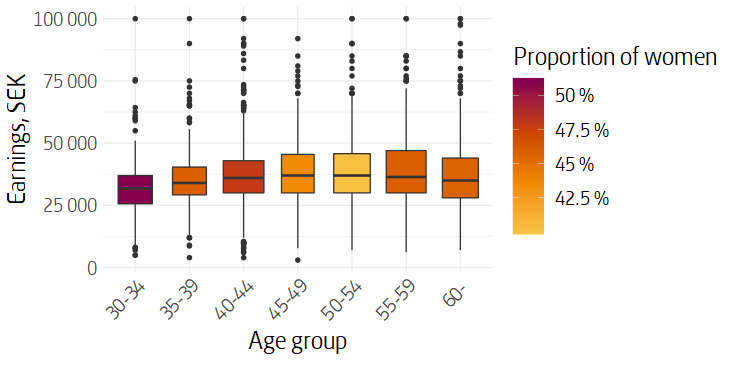
Figure 3 shows the spread of the various choices based on gender. As the figure shows, there are no major differences between men and women in terms of their choices of the various parameters.
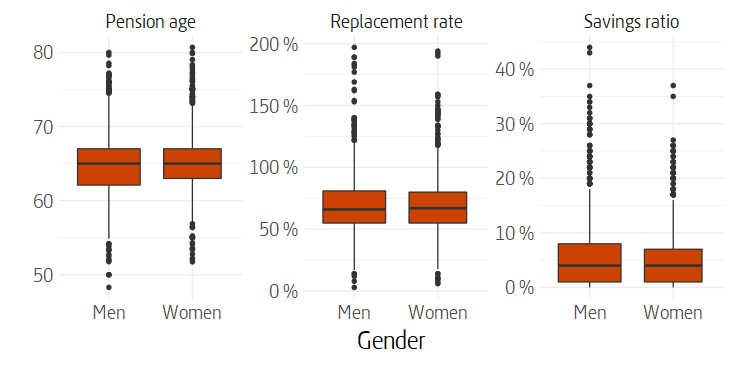
Figure 4 shows the chosen replacement rate, pension age and savings ratio by earnings group. As the figure shows, the mean replacement rate is higher for lower earnings, while the mean savings ratio is higher for higher earnings. Some of this is “built into” the model, as, for example, people with lower earnings are to some extent compensated by a guarantee pension, which means they will end up with a relatively higher replacement rate without having to compensate through a higher pension age or increased savings. It is also likely that the slightly higher level of savings that is chosen as earnings increase is explained by the fact that higher earnings can offer more scope for saving.
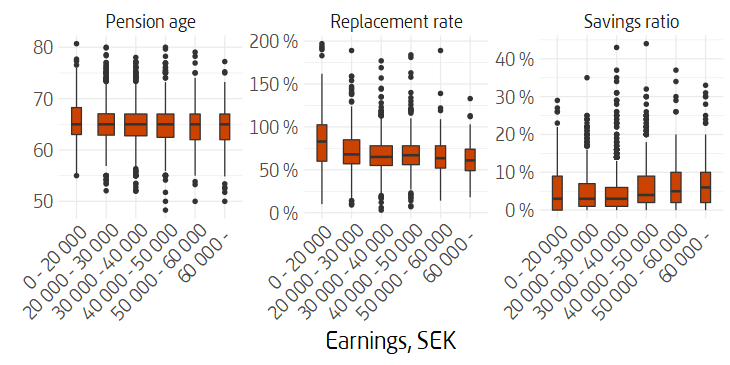
Figure 5 shows the same parameters, but based on age groups. A similar pattern is apparent here as for the earnings groups in figure 4 , with higher replacement rates for lower ages. The fact that the patterns are similar may be linked to the co-variation of earnings and age, as shown in figure 2 in the form of lower earnings in the lowest age group. As mentioned above, people with lower earnings in the model are partly compensated by basic economic protection for the elderly, which may explain why those in the youngest age group chose a relatively high replacement rate without apparently needing to compromise on a significantly higher savings amount or lower replacement rate.
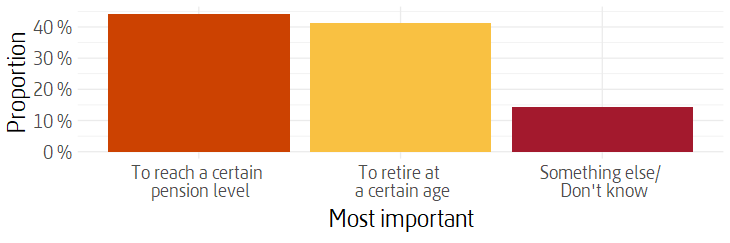
By way of introduction, the survey also asked whether participants consider it more important to reach a certain pension level or to retire at a certain age. Figure 6 shows the proportion of respondents who stated the respective possible responses. Approximately the same proportion of respondents consider pension level and pension age to be more important respectively.
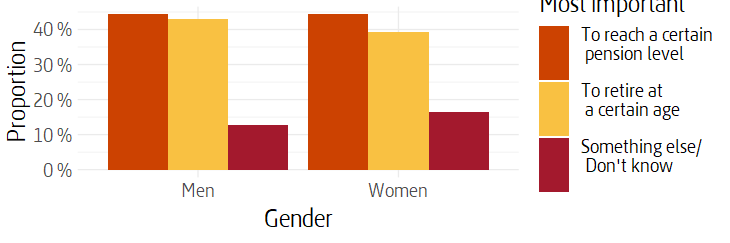
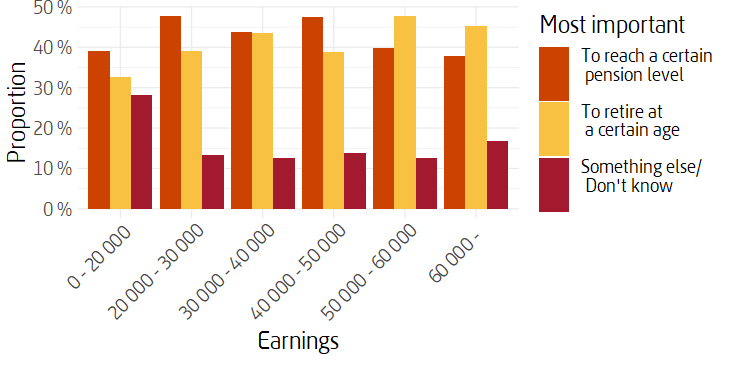
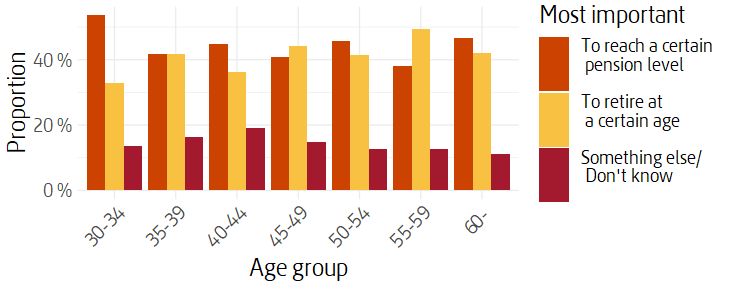
Figures 7-9 below show the responses to the same question broken down by gender, earnings and age. There are no clear differences between the groups, but there is a tendency among older people to give greater priority to retiring at a particular age than younger respondents. A slight trend is also apparent for earnings levels where those with higher earnings tend to prioritise a particular pension age more often than those with lower earnings.
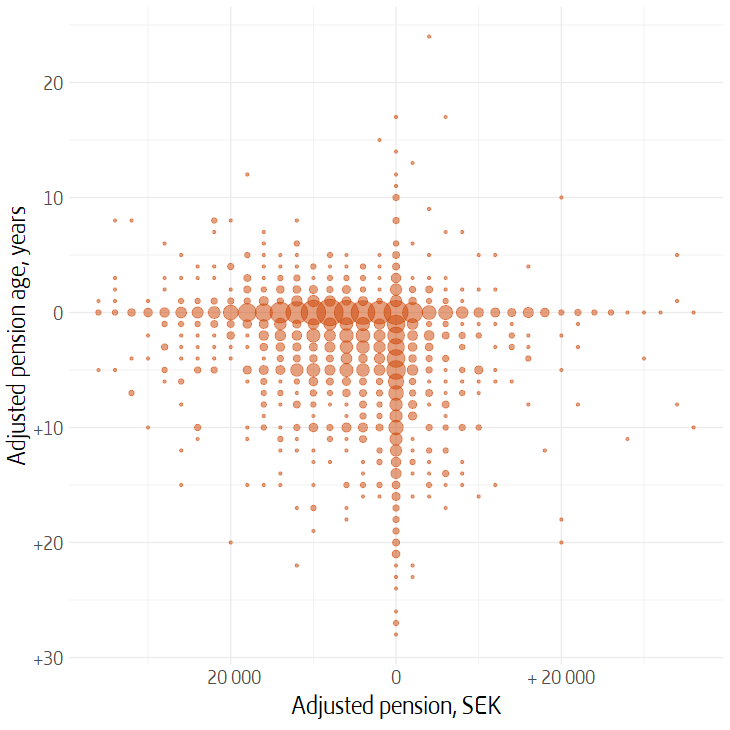
At the start of the survey, before respondents were asked to strike a balance between pension age, pension level and any savings, they were asked to indicate their preferred pension level and pension age without having to make financially consistent choices. Figure 10 shows the difference in responses between these initial open questions, where respondents were free to choose the pension age and pension level they wanted, and the questions where they were constrained by the actual financial circumstances with the various choices being mutually dependent. The smallest dot corresponds to a person. The larger the dot, the more people have adjusted their pension age and pension level by a value within the specified range compared to the completely open question. The horizontal axis indicates whether people increased or decreased their pension level, while the vertical axis indicates whether they increased or decreased their pension age compared with the completely open question.
The figure shows that most respondents in the survey have adjusted their pension level downwards and/or their pension age upwards, as can be deduced from the many large dots along the axes within the lower left-hand quadrant of the figure. Similarly, it is apparent that, among those who either maintained their preferred pension age or pension level as stated in response to the introductory open questions, it is more common to maintain the preferred pension age and opt for a lower pension instead. This is apparent from the fact that there are more people - larger dots - who did not adjust their pension age than did not adjust their pension level.Table 3 summarises the data in the figure and shows the proportion of respondents who adjusted their choices through a certain combination of reduced, maintained and increased pension age and pension level.
| Reduced pension | Maintained pension | Increased pension | Total | |
|---|---|---|---|---|
| Reduced age | 7 % | 2 % | 1 % | 10 % |
| Maintained age | 30 % | 3 % | 7 % | 40 % |
| Increased age | 27 % | 16 % | 7 % | 50 % |
| Total | 63 % | 22 % | 15 % | 100 % |
Through a parliamentary decision, the age at which a person can start receiving their general pension has been raised from 61 to 62 with effect from 1 January 2020 (read more about pension age, in Swedish). This represents the first step in a series of planned changes which also introduce the new concept of recommended retirement age, which can be considered to be the successor to the 65-year age limit.
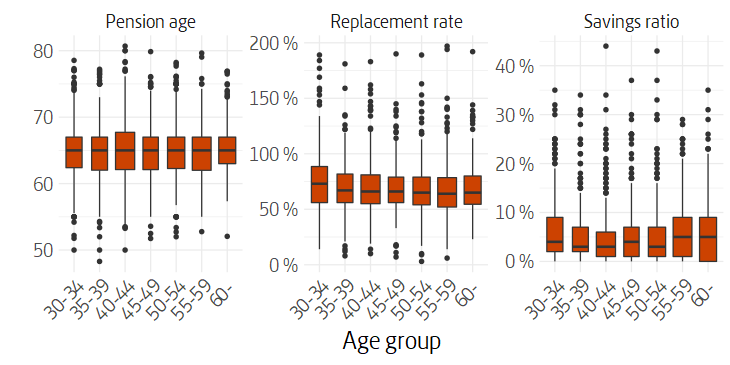
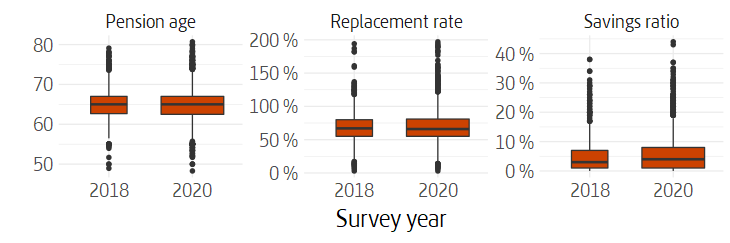
As table 1 showed, there is no clear difference in the mean age that was chosen, nor in the replacement rate or savings ratio, between the two survey years. The spread for the various parameters is also similar, as is apparent from figure 11. In this respect, the survey gives no indication as to whether there has been any shift in chosen pension ages as a result of the raising of the minimum age at which the general pension can be taken and the parliamentary decision to introduce the recommended retirement age.
The same applies if you consider the proportion who stated that they wish to retire before they reach the age of 65, when they are 65 years of age or when they have reached the age of 66 in table 4. If all respondents are considered, the proportion of those who indicated the respective alternatives is very similar between the two years.
| Chosen pension age | Women | Men | Total |
|---|---|---|---|
| 65 | 25 % (24 %) | 23 % (23 %) | 24 % (23 %) |
| Over 65 | 33 % (36 %) | 35 % (32 %) | 34 % (34 %) |
| Under 65 | 42 % (40 %) | 43 % (45 %) | 42 % (43 %) |
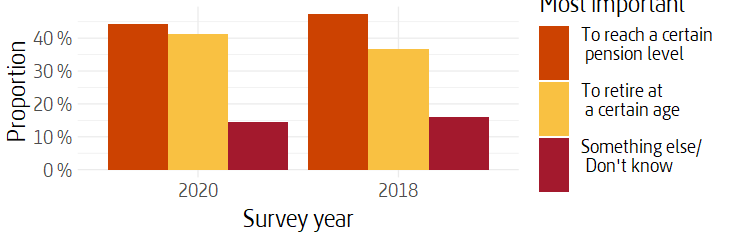
A difference between the 2018 and 2020 surveys is apparent in the responses to the question about what is more important for the respondent’s pension, where respondents could choose between reaching a certain pension level or retiring at a certain age. Figur 12 shows that a slightly higher proportion of respondents indicated that they consider a certain pension age to be more important as regards their decision to start drawing a pension in 2020 compared with 2018.
In a separate survey conducted in connection with this survey, we asked a number of questions about the raised pension age and the new recommneded retirement age age. These questions were put to pension savers aged 20-65. In this case, it appears that respondents believe they will be able to retire at an average age of 67. Younger respondents believe they will be able to retire later and the older respondents earlier.
Eight percent say they are familiar with the concept of the recommended retirement age, while 79 percent say they are familiar with or have heard about the recent decision and future proposals to raise the pension age. Twenty two per cent of respondents said that it has affected their plans on when to start taking a general pension.
At the same time, only just over half (54 percent of those interviewed) stated that they know the age at which it is currently possible to start drawing a general pension. More older respondents said that they knew this age compared with younger respondents. Among those who said that they know the age at which you can currently start drawing a pension, only 39 percent stated the recently introduced pension age of 62 years, while 19 percent answered the previous pension age of 61, and 12 percent answered 65 years.
When asked why they think there is a desire to raise the pension age, about 40 percent spontaneously responded that life expectancy is increasing and that we are living longer and more healthily, and thus able to work longer. About 40 percent stated that they believe that the pension age was raised for economic reasons, that it is a way of funding pensions or other government expenditure and that more money/tax must be raised in order for there to be sufficient money available. Approximately 14 percent mentioned that the proportion of elderly people among the population is rising, and more people need to remain in work in order to support them. Four percent say they believe that the reason there is a desire to raise the pension age is because there is a need for labour. Few respondents mentioned the benefits to themselves of working longer, i.e. that their own monthly pension would be greater if they worked for longer.
Do the results of the survey reflect people’s true values? There is a reasonably strong indication that this is the case in the survey’s mean replacement rate, pension age and savings ratio, which are close to the mean values for the actual choices made by pension savers in reality.
The report entitled Pension levels and replacement rates for recent retirees 2016 (in Swedish) states that the mean replacement rate for the sum of general and occupational pensions was 81 percent, if the tax reduction for the general pension charge is not taken into account, or 75 percent if it is taken into account. The latter figure is more relevant to compare with the survey’s 69 percent. One reason why actual replacement rates are so high is that many people’s earnings decrease towards pension age, which results in a higher replacement rate than if earnings remained constant. The survey model calculates the desired savings resulting from the savings that respondents accumulate throughout their lives The mean preferred pension age in the survey is approximately 65 years, which is close to the actual mean of 64.5 years for the drawing of a general pension; see the Swedish Pension Agency’s report Pension ages and the duration of working life (in Swedish).
According to Statistics Sweden (2019), the mean of the survey responses for supplementary savings of 6 percent is slightly higher than the mean financial savings of households of 3.5 percent. Of the three trade-offs, we believe that pension age and pension level are factors which respondents find easier to perceive as impacting their own situation than supplementary “saving”. It may be that respondents implicitly or explicitly do not associate more savings with less money to live on now. The result may also have been influenced by individuals wanting to be, or appear to be, responsible when answering questionnaires.
The spread in how respondents made their choices also mirrors the way in which pension savers make their choices in reality, although the spread is greater in the survey’s results. There is also no significant correlation between the gender, age and earnings of respondents and how they strike a balance between pension age, pension level and supplementary savings.
One possible conclusion of the wide spread and lack of clear correlations between the gender, age and earnings of persons and how they make their choices is that pension savers, regardless of their gender, age and earnings, appreciate the freedom of choice in terms of pension age and savings that they have, and thus how much they will receive in terms of monthly pension level.
A further possible conclusion to be drawn from the wide spread is that compulsory pension provisions via employers should not be greater than what pension savers themselves can choose to have in the form of their own supplementary savings. The fact that the respondents to the survey make trade-offs which are, on average, relatively close to the choices made by pension savers in reality could be considered to support the structure of the current system.
However, this conclusion presupposes that pension savers support the financial links arising from current laws and agreements. These financial links can be described, in somewhat simplified and therefore misleading terms, as indicating that in principle everyone pays their own pension.
The mean chosen savings ratio in the 2020 survey is on a par with that in the 2018 survey, even though no information concerning how much employers set aside for pensions was provided in the 2018 survey. It may be that a person’s propensity to save is not influenced by knowing how much their employer is already setting aside for their pension. It may also be that the respondents’ perception is that pension contributions made by their employer are “supplementary” and that the respondents in both the 2020 and 2018 surveys based their responses on their finances disregarding these contributions when they made their savings choices.
As regards the question of whether pension age or pension level is more important, around half of the respondents stated that they consider pension age to be more important and half stated that they consider pension level more important. At the same time, it appears that a higher proportion of respondents stated that they consider pension age to be more important in the 2020 survey than in the 2018 survey. It is also apparent that slightly more respondents maintained their preferred pension age than maintained their preferred pension level in a comparison between the unrestricted and financially constrained choices.
One possible conclusion to be drawn from this is that pension age is an important parameter, which may become increasingly important over time. It remains to be seen whether the proportion who consider pension age to be more important than the pension level in the foreseeable future overtakes the proportion who consider pension level to be more important than pension age.
Finally, the supplementary survey shows that relatively few respondents see the immediate benefits to themselves in the form of receiving a higher monthly pension through working for longer, and tend to interpret the increase in pension age as a way for the state to raise more money instead. One possible conclusion to be drawn from this is that the Swedish Pensions Agency should be clearer in its communication regarding the benefits for pension savers to be gained by working for longer.
The survey was conducted as a questionnaire, where respondents were asked to answer questions about their current earnings and age, and to choose different combinations of pension level, pension age and savings in a model where a change in one area affects the other areas. For example, when respondents chose a high pension level, they also had to choose a higher pension age and/or a higher level of savings.
The questionnaire was distributed by e-mail to a nationally representative sample of Sweden’s population in the 30-65 age group, but excluding pensioners via Kantar Sifo’s randomly recruited web panel. The survey was conducted during the period 9 to 31 March 2020. A total of 3,000 interviews were conducted.
In 2018, the same survey was conducted using the same approach, with a total of 1,000 interviews being conducted.
The supplementary questions concerning pension age and the recommeneded retirement age were conducted through a nationally representative sample between the ages of 20-65, but excluding pensioners via Kantar Sifo’s randomly recruited web panel in April 2020. A total of 1,289 interviews were conducted.
- Respondents who stated a replacement rate in excess of 200 percent, a pension age of more than 80 and a savings ratio of more than 50 percent are considered to be extreme values and have been excluded from the results. ↩